Aggregate Calculations and Reports
Aggregate Calculations
For background on what aggregate calculations are, please see http://www.postgresql.org/docs/current/interactive/tutorial-agg.html
In agileBase, a quick and easy way of viewing aggregate data is to use charts, which create them behind the scenes.
However, if you have relations (joins) in the view, then aggregate calculations can be added directly into the view like any other calculation, which is more powerful in some situations.
Example
Say there’s a timesheet table that records hours spent on work on particular client jobs. The time sheet table has a relation field linking it to an organisations table that holds client details. We want to total up hours spent per client. To do this, you’d perform the following steps:
- Create a new view under the organisations table
- Add a join in the view to the timesheet table
- Add a calculation such as sum({timesheet.hours})
There should now be one row per organisation, with the total timesheet hours listed for each.
Explanation
When you add an aggregate such as a sum or average, agileBase automatically groups rows by the parent table’s record identifier (technically, the ID plus all the other report fields). So to usefully add an aggregate, you should join in another report B that the current report A has a one to many relationship with. In the above example, when the sum calculation was added, portalBase automatically added a grouping by the organisation ID.
This means that you shouldn’t add in any fields from B to the report, otherwise the grouping will include them and the aggregate calculation won’t work as intended.
The example report could of course be joined to others and further calculations done, such as multiplying the hours by a standard rate to get a chargeable amount.
Going further
Many useful aggregates exist, beyond summing data, for example text in many rows can be merged into one. For further details, please see http://www.postgresql.org/docs/current/static/functions-aggregate.html
Aggregate reports
A common wish, once people have a system flowing with lots of data, is to query it in aggregate. In other words, summarising the data by counting things or totalling up values of items in different categories.
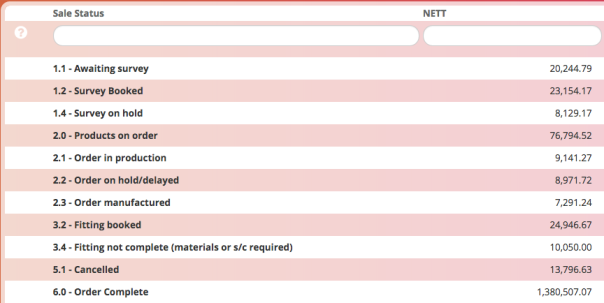
Here’s an example, a report of the total value of sales in each stage of a manufacturer’s pipeline.
Other examples might be an accounts summary showing profit and loss by year, or sales by salesperson by month.
Often also, you want many figures for the same grouping, e.g. for each month, you could see total sales, total costs, total upsells, number of unique customers, profit, etc. etc.
One way to see these is to use agileBase’s charting features, but often spreadsheet-type reports are better suited to the task at hand. Creating these has also been possible but it often involves quite complex report creation including lots of joins and calculations.
Now, it’s literally been condensed down to ticking one tick-box. In the ‘manage’ tab for a view is a new option ‘use groupings’. Ticking this has a simple effect on the view. Rather than showing one line per record in the database, It will group the view by all the fields visible (excluding any aggregate calculations like totals and counts). So for example, if you create a view containing the field ‘sale status’ (as per the screenshot above), tick the ‘use groupings’ option and add the calculation
sum({sale value})
the outcome will be the example report above. Add as many other calculations or other fields as you like. Each other field will become a sub-grouping.
It couldn’t be any easier. This will not only save hours of work and cost, but let customers take over even more of the build process of an app themselves.
Feedback
Was this page helpful?
Glad to hear it! Please tell us how we can improve.
Sorry to hear that. Please tell us how we can improve.