Administrator Information
Administrator Information
… or at least interesting to look at.
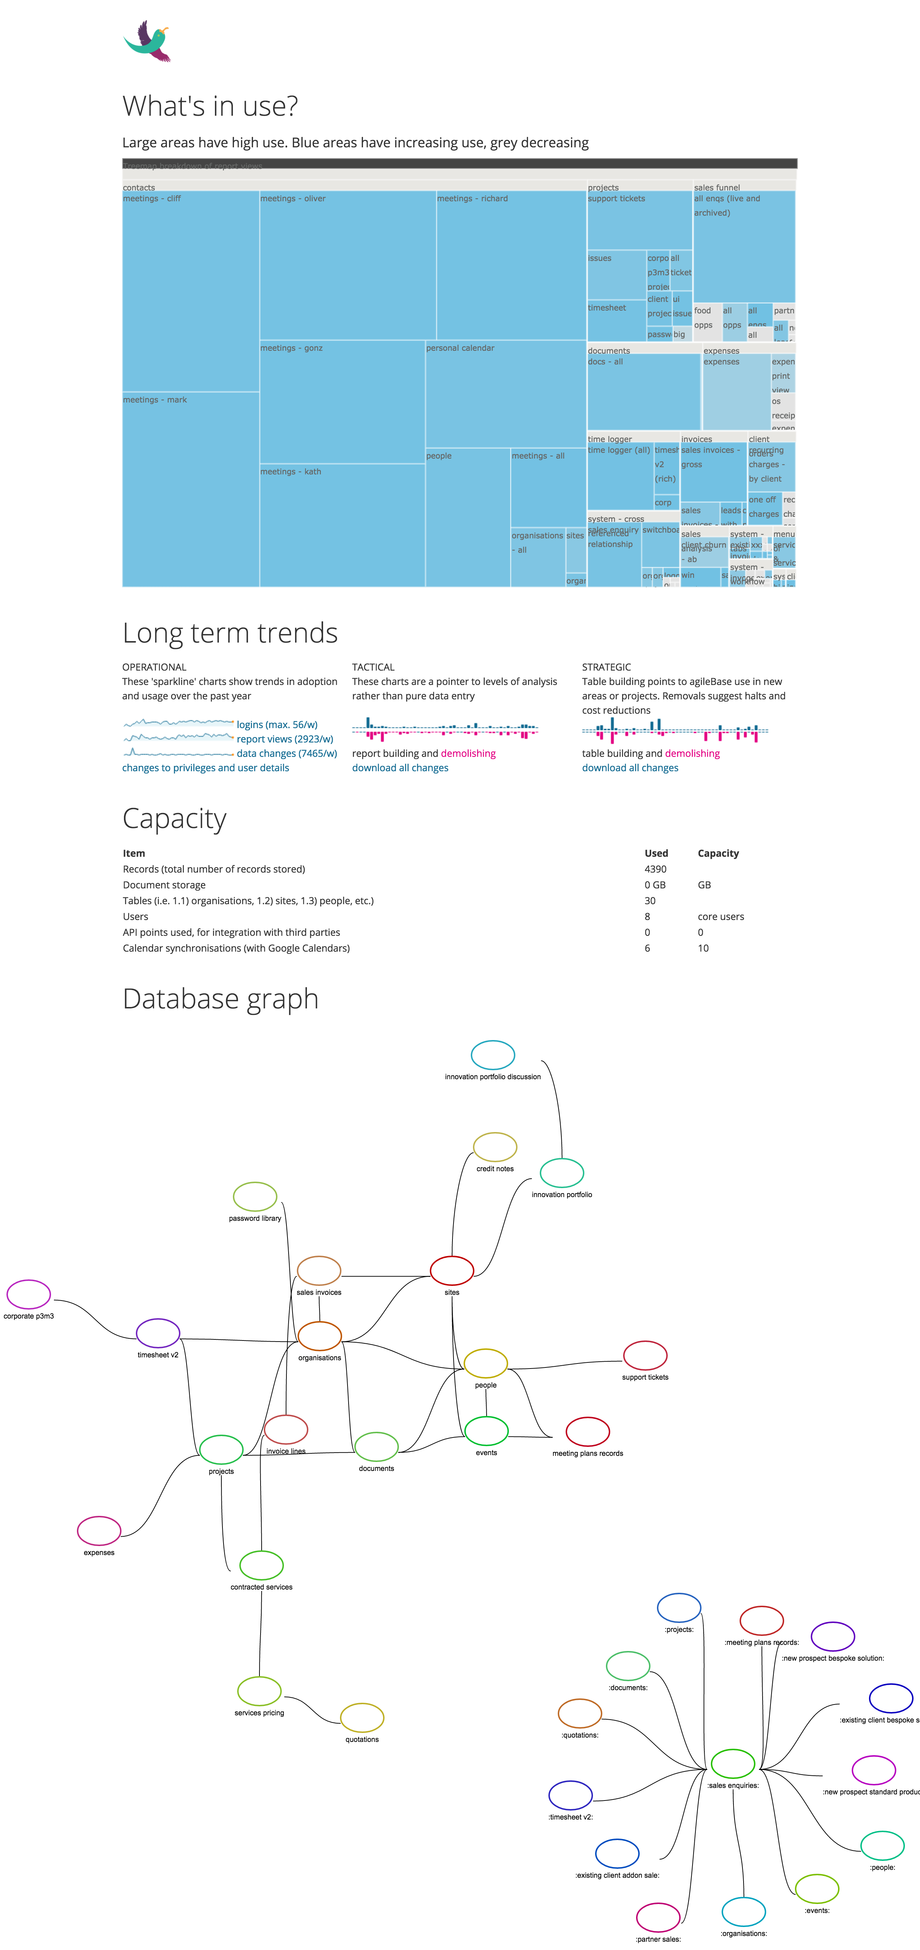
The above is an example of our administrator information page – it shows you information about what’s going on in your agileBase account: which parts are most used and by who, trends, capacity and usage etc.
The graph at the bottom, shows the structure of the database, how different parts of the system are connected together. This can be useful when bringing a new developer or admin onto a project for example, or for planning, to see where parts can be trimmed or added.
Sometimes when systems get really large, the graph can look a bit dense and confusing, with lots of interlinking lines crossing each other. To mitigate that, tables with the most connections are split out into their own little sub-graphs. In the example above, the ‘sales enquiries’ table has been split out into it’s own section, with connections to other parts cut. You can then easily see all the other tables that relate to sales enquiries, which would have been more difficult otherwise.
Feedback
Was this page helpful?
Glad to hear it! Please tell us how we can improve.
Sorry to hear that. Please tell us how we can improve.